
Back to Basics : Analysis Workspace : Part 1
As an Analytics Technical Consultant, I have always been piqued by the need to create wonderful looking, insightful dashboards using Adobe Analysis Workspace. This Back to Basics series will cover all my learning about Adobe Analysis Workspace and hopefully spur me on a different path later.
Analysis Workspace is Adobe’s premier data visualization and analysis engine. Analysis Workspace provides ability to visualize data and answer business questions that are critical to turn your company into an Analytics powerhouse.
But before you start using Analysis Workspace, you need to understand the structure and how the settings that enables Workspace to generate insights.
Analysis Workspace 101
There are multiple concepts and components of an Analysis Workpsace project. But at the very basic level you can think of the Workspace as a highly evolved spreadsheet. You have the familiar rows and columns and ability to apply formulas, create new metrics etc.
Let’s see how
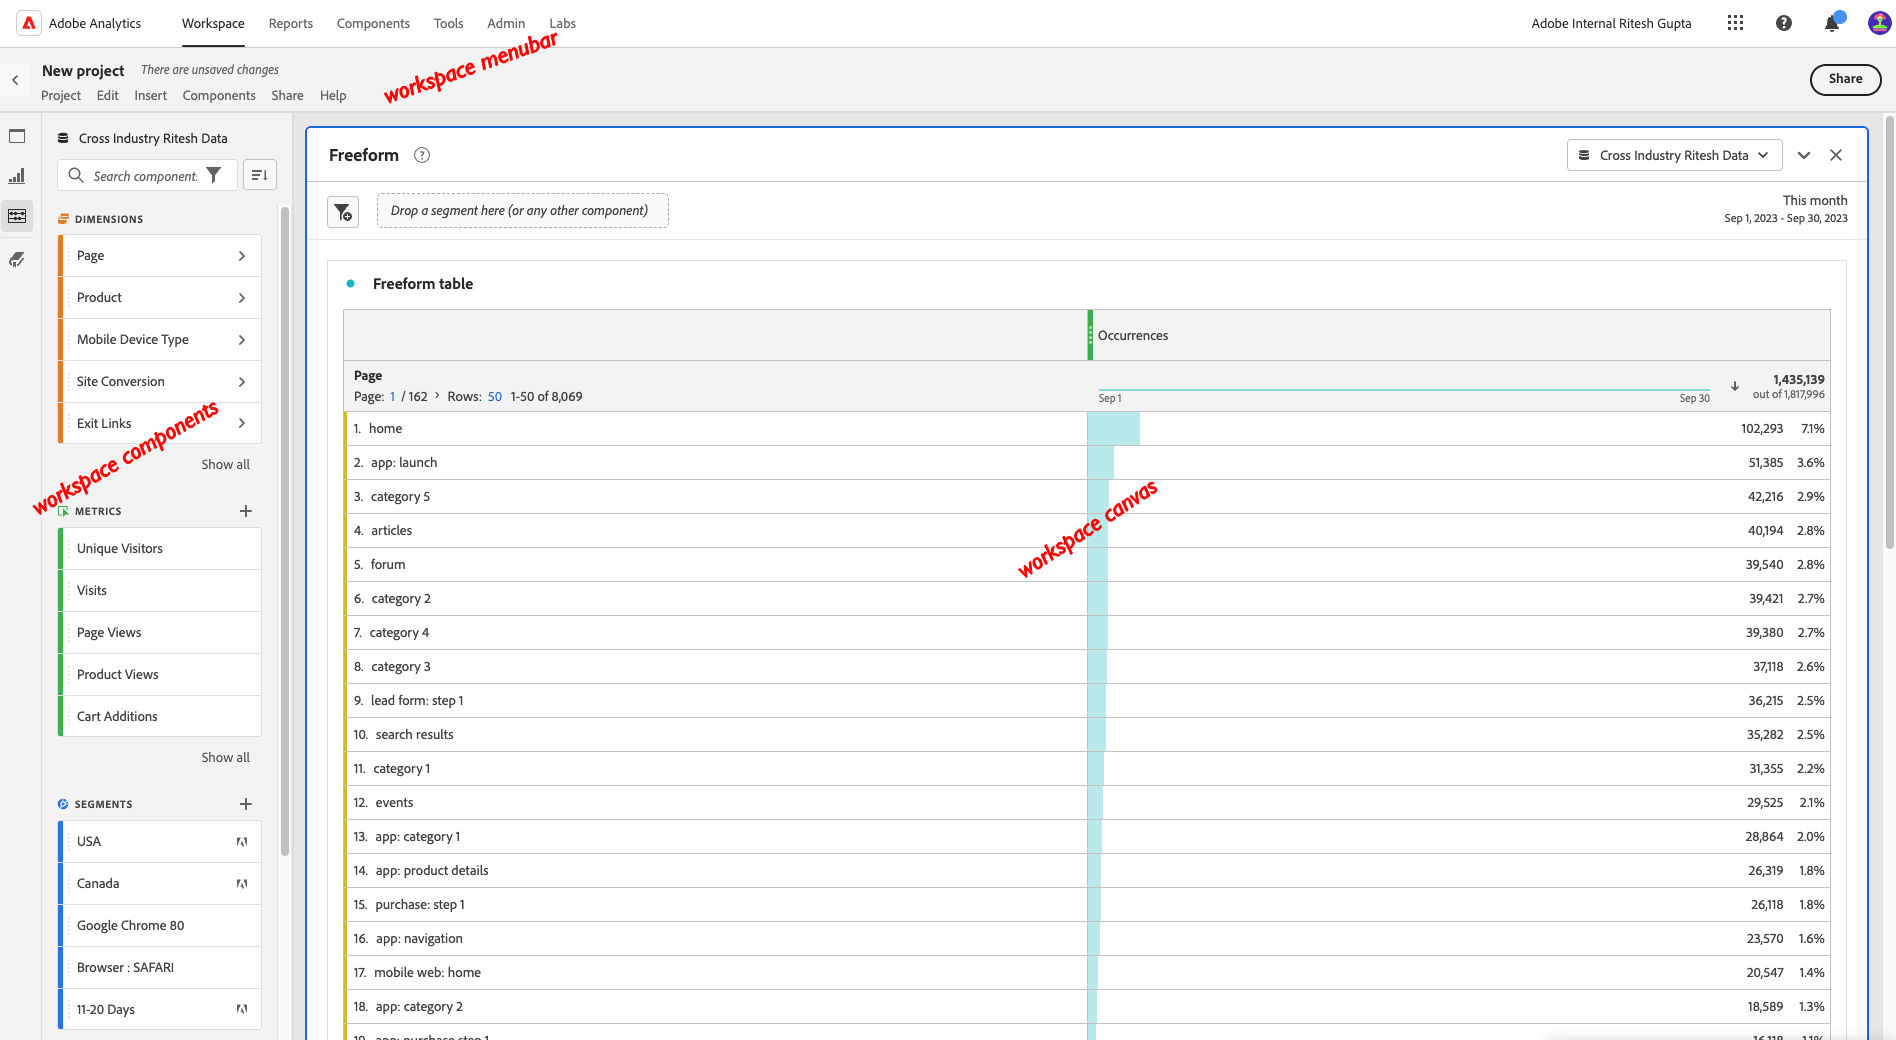
Broadly, an Analysis Workspace project has three main components:
- Workspace Canvas
- Workspace Components
- Workspace Menubar
Let’s look at each component in details:
-
Workspace Canvas: The Workspace Canvas is where all the visualization and insight generation happens. It is the space in your spreadsheet where you work with numbers, formulas and visualizations. It is a highly interactive and dynamic section of the Workspace project, and provides a drag and drop interface to users
-
Workspace Components: The Workspace Components comprises of the elements that help the Canvas to visualize data. It is a mix of dimensions, metrics, segments and date ranges. It also provides the ability to create new components right from within the section itself
-
Workspace Menubar: Just like a menubar in any other application, the Workspace Menubar allows you to create new projects, share, download, interact with components and do more. It carries certain features of the Components region
More details coming soon!
